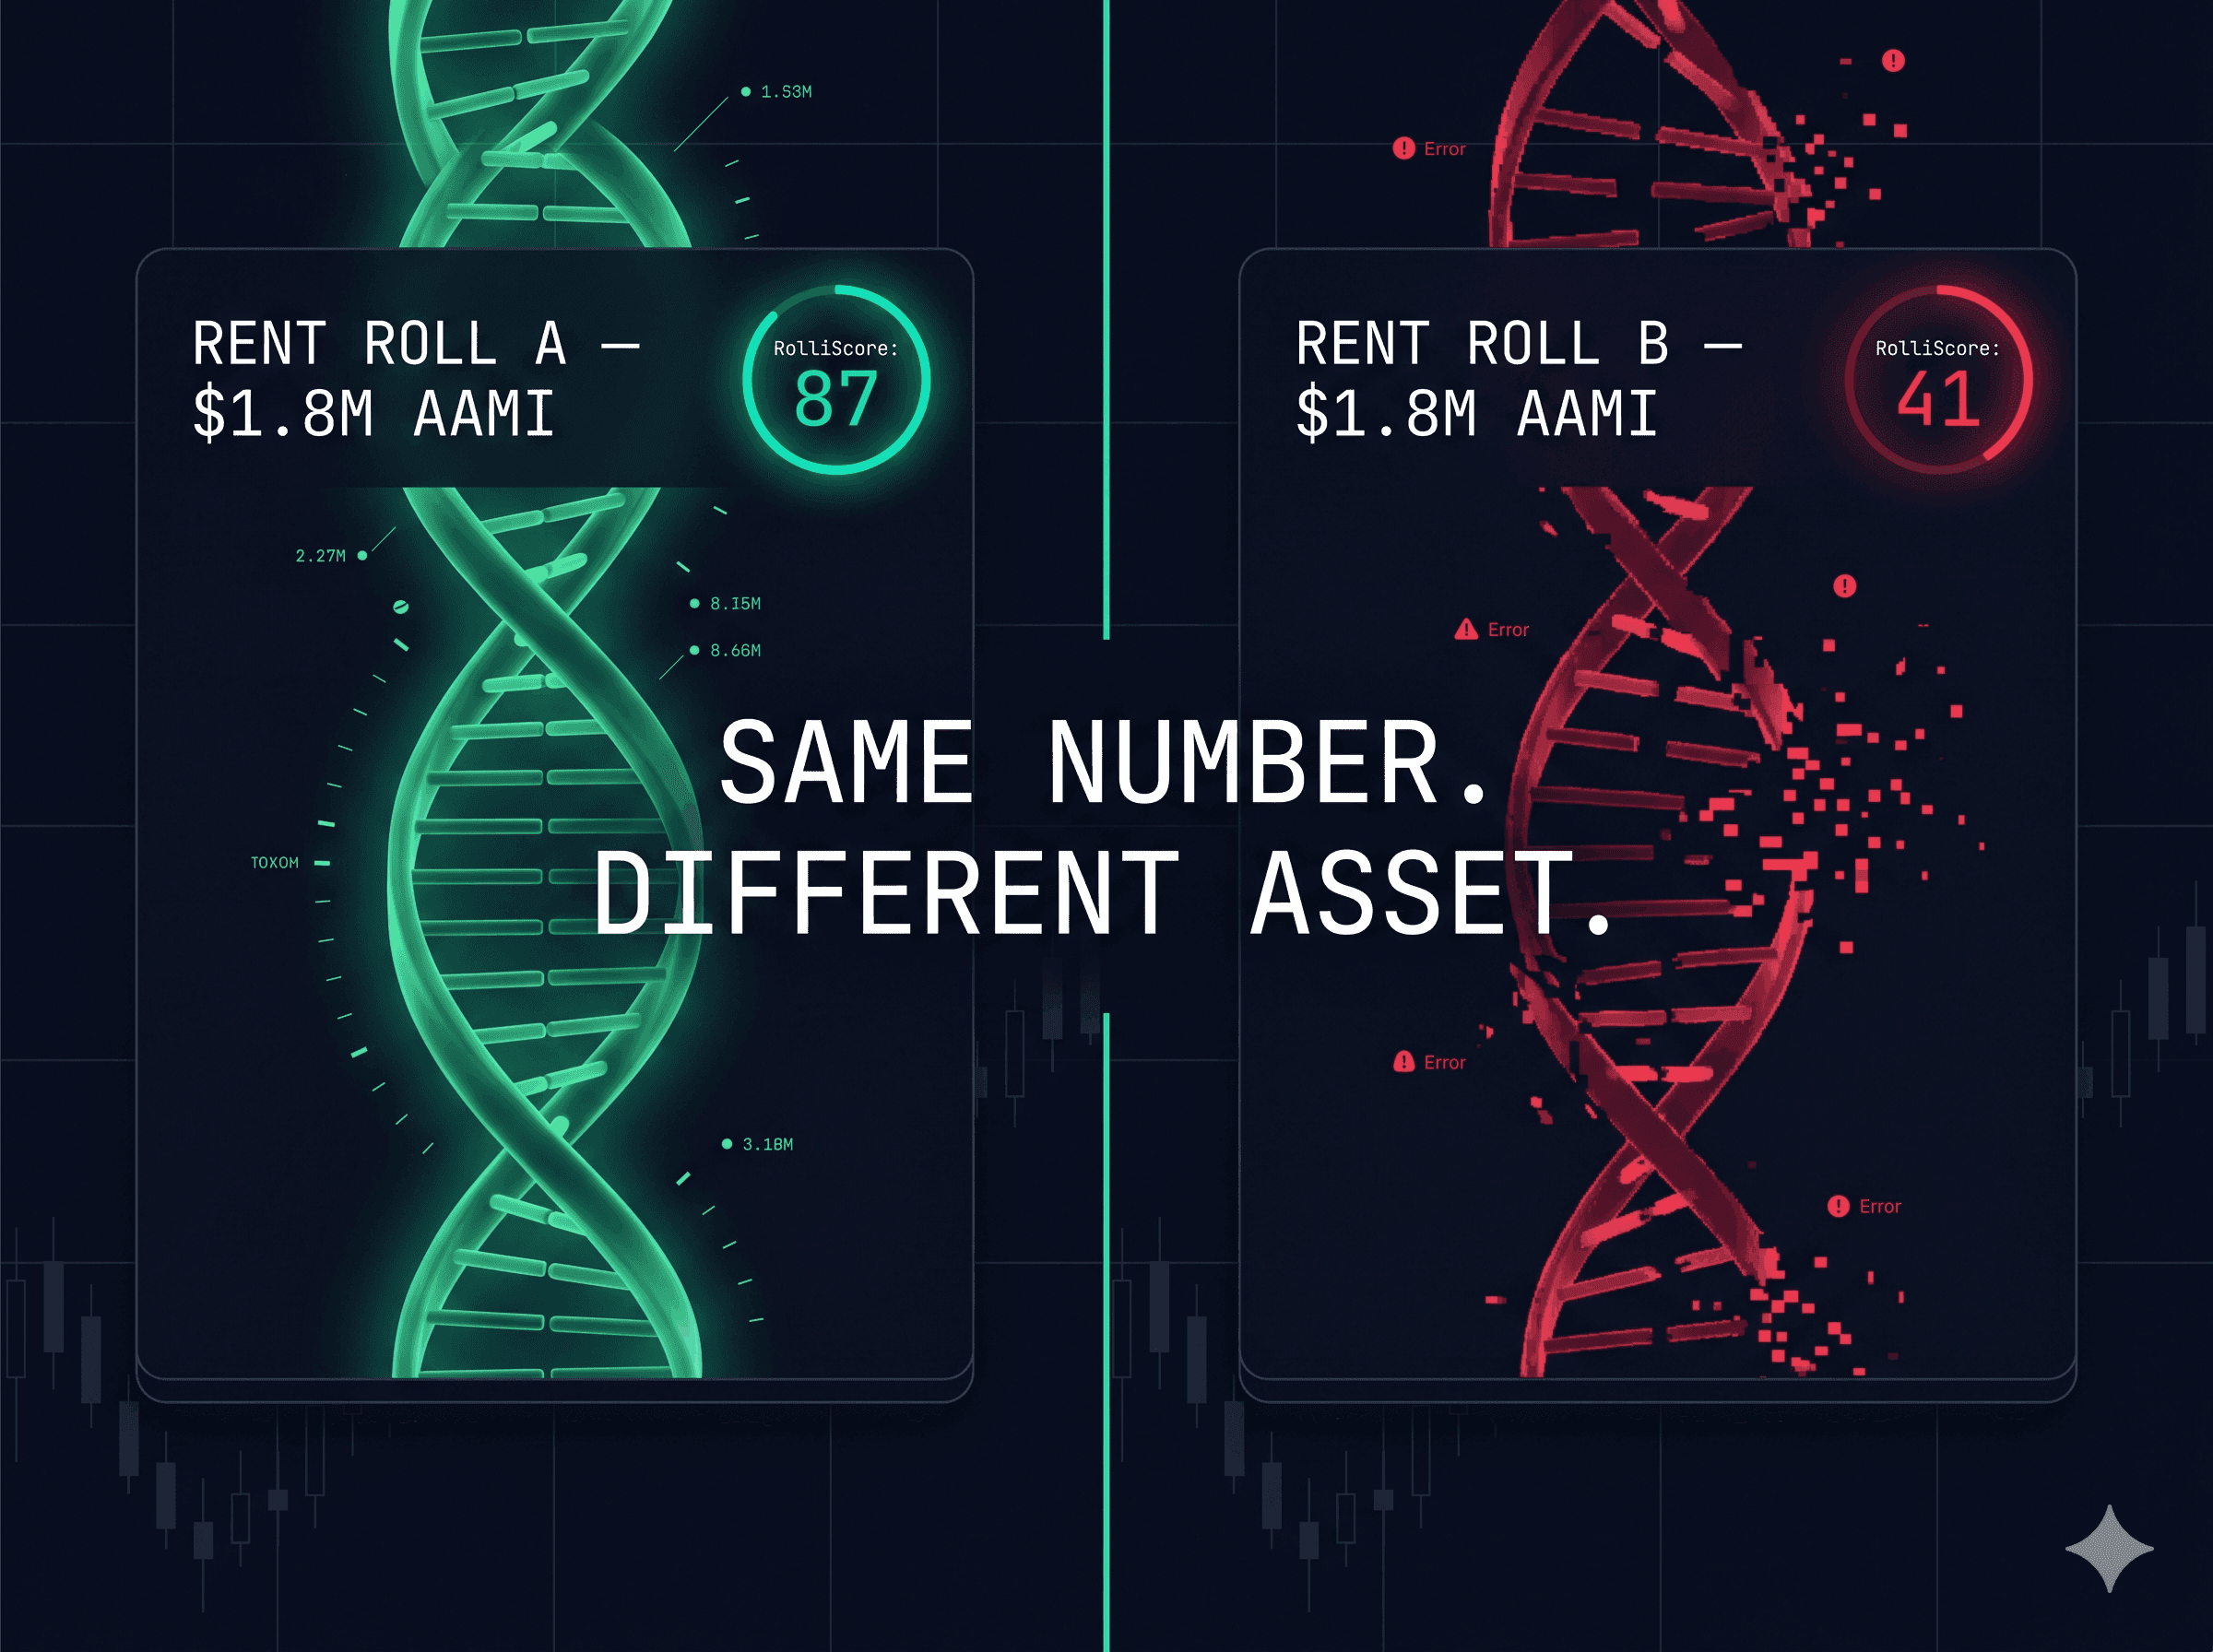
Every Australian Principal can quote the AAMI formula. Almost none can explain why their neighbour's rent roll just sold for 0.5x more than theirs on identical numbers. The answer isn't in the formula. It's in the DNA underneath it.
Every Principal in Australia can quote the formula.
AAMI × multiplier = rent roll value.
You know it. Your accountant knows it. Your broker definitely knows it (because they wrote it on the back of a napkin in 2014 and have been using the same napkin ever since).
So why does one $1.8M rent roll sell for $2.04M while a virtually identical one down the road sells for $1.62M?
It's not luck. It's not the broker's negotiation. It's not "market conditions."
It's the seven factors hidden underneath the AAMI number — the structural DNA of your portfolio that institutional buyers, sophisticated brokers, and fund-backed acquirers have started measuring with surgical precision. Most Principals can't see this DNA. The buyers absolutely can.
This article will show you what they're seeing.
First, the formula everyone agrees on (the 2-minute refresher)
For the avoidance of doubt, here's the foundation:
AAMI (Average Annual Management Income) = Average weekly rent × management fee % ÷ 7 × 365
Multiply your AAMI by the number of properties under management, then apply a multiplier — typically somewhere between 2.0x and 3.6x in the current Australian market — and you have an indicative rent roll value.
Example:
250 properties under management
$580 average weekly rent
7.5% average management fee
AAMI per property = $2,266
Total AAMI = $566,500
Multiplier of 3.0x = $1,699,500 indicative value
That's the napkin. Every broker in Australia draws the same napkin.
Here's what the napkin doesn't tell you.
The difference between a 2.4x and a 3.6x multiplier on a $600K AAMI portfolio is $720,000. Not a typo. Three quarters of a million dollars — sitting in factors that don't appear on the napkin.
So what moves the multiplier? Seven things. In order of how much they typically swing the number.
1. Geographic Density (the silent multiplier-killer)
How tightly clustered are your managed properties?
A portfolio with 80% of its properties inside a 6km radius will trade at a meaningful premium to the same-AAMI portfolio scattered across three council areas. Why? Because operating costs scale with distance. A property manager who can do six routine inspections in one morning is operationally worth more than one driving 45 minutes between appointments.
Buyers know this. Lenders know this. The portfolio with tight density gets:
Lower operational cost projections
Easier staff retention (no one wants the postcode-hopping run)
Faster integration into an acquirer's existing book
Multiplier impact: Tight density (>70% within 8km) typically lifts the multiplier by 0.2x – 0.4x. Scattered density (book spread across 4+ council areas) typically drops it by 0.2x – 0.5x.
On a $600K AAMI portfolio, that's a swing of up to $540,000 based on a factor most Principals have never measured.
2. Landlord Concentration (the hostage situation)
How much of your AMI is tied to your top 10 landlords?
If the answer is "I'm not sure, but it's a lot," your portfolio has a structural risk that any sophisticated buyer will price in hard.
Industry research suggests the median Australian rent roll has roughly 35–40% of AMI tied to its top 10 landlords. Some portfolios run much higher — we've reviewed books where 60%+ of revenue sits with under 15 landlords.
That's not a portfolio. That's a hostage situation with a multiplier on top.
Why? Because if just three of those landlords decide to sell, retire, or move their portfolios after settlement, the buyer's revenue projection collapses. Buyers either:
Discount the multiplier heavily, or
Demand extended retention/clawback periods, or
Walk away entirely.
Multiplier impact: A book with <20% top-10 concentration trades at a clear premium. A book with >50% top-10 concentration typically drops the multiplier by 0.3x – 0.7x, or attracts brutal retention terms (e.g., 30%+ held back for 18+ months).
3. Fee Integrity & Legacy Fee Drag
Most Principals charge consistent management fees today. Almost no Principal has consistent management fees across the book.
That landlord you signed up in 2017 on a 5.5% special? Still at 5.5%. The investor who came across from your competitor on a "we'll match it" deal in 2020? Still at 6%. The three managements you took on for a friend? Charity rates that everyone's forgotten about.
Across most Australian rent rolls, 8% to 18% of managements sit on legacy fee structures below current market rates. That's pure leakage — recoverable AMI sitting in plain sight.
Buyers do this analysis in their first hour of due diligence. They model the portfolio at "rebased" fees, then ask you why you haven't done it yourself. The answer ("I keep meaning to") makes you look operationally weak before the negotiation even starts.
Multiplier impact: A book with clean, consistent fees can recover 3–7% additional AMI before sale — directly inflating the AAMI base the multiplier is applied to. On a $600K AAMI portfolio, that's $18K–$42K in unrecovered revenue that compounds through the multiplier into $54K–$150K of valuation upside.
4. Tenure & Churn DNA
How long has the average property been on your books? How long has the average tenant been in the property?
A portfolio with long-tenured managements and long-tenured tenancies is materially more valuable than a high-churn book of the same AAMI, because:
Lower acquisition cost amortisation
Lower vacancy risk
Lower re-letting costs in the buyer's pro-forma
Stronger evidence of landlord satisfaction
The metric that matters: management tenure (how long landlords stay with the agency) and tenancy tenure (how long tenants stay in each property). Buyers are increasingly modelling these separately.
Multiplier impact: A portfolio with average management tenure >5 years and tenancy turnover <12 months annually trades at a premium of 0.2x – 0.4x over the median. The reverse — short management tenure and high tenancy churn — can compress the multiplier by 0.3x – 0.5x.
5. Property Mix & Asset Type Concentration
A portfolio of 250 standard 2-3 bedroom freestanding houses in residential suburbs is the most fundable, most tradeable, most predictable rent roll asset class in Australia. Lenders love it. Buyers compete for it.
The further your portfolio deviates from that baseline — heavy units, complex strata, commercial mixed in, student accommodation, short-term holiday properties — the more your buyer pool shrinks, and the harder the negotiation gets.
Not because those property types are bad. Because they require different operational capability, different lender appetite, and a different buyer who's set up for them.
Multiplier impact: A "vanilla" residential book has a deep buyer pool and trades efficiently. A specialised or mixed book typically loses 0.2x – 0.5x simply on reduced buyer competition.
6. Data Integrity & "The Spreadsheet Problem"
This one is invisible to Principals until the moment they try to sell.
Most rent rolls live across three to five disconnected systems: a trust accounting platform, a CRM, a property management system, a manual fee tracker, and the property manager's brain. When a buyer asks for clean reporting, the data has to be reconstructed — and reconstruction always exposes inconsistencies, gaps, and timing mismatches.
Buyers price uncertainty at a discount. Every gap in your data is a justification for a lower multiplier or a longer retention period. Every clean, reconciled, verified data point you can produce upfront moves the negotiation in your direction.
This is the gap RentRolli was specifically built to close — verified portfolio data that doesn't require reconstruction at point of sale. But even without us, the principle stands: if your data lives in 4 places and disagrees in 3 of them, you've already lost 0.2x on the multiplier before the buyer's lawyer arrives.
7. The "Going Concern" Premium (the one most Principals undersell)
The final factor is structural: is the buyer acquiring just the rent roll, or are they acquiring an operating business?
A rent roll sold as a standalone asset trades at the AAMI × multiplier formula above. A rent roll sold as part of a going concern — with trained staff, established systems, supplier relationships, and brand goodwill — can trade at a 15–30% premium to the bare-rent-roll number, because the buyer is acquiring revenue with the operational infrastructure to retain it.
Most Principals don't realise they have the option to structure the sale this way until it's too late. Engaging the right broker early, building documentation around the operating business (not just the rent roll), and presenting the business as transferable infrastructure — not just a customer list — is where the real upside lives for owners selling their life's work.
Putting it together: the new way buyers are valuing rent rolls in 2026
The traditional napkin — AAMI × multiplier — is no longer how serious money values your portfolio. It's how the headline number is calculated. The actual price is a function of the seven factors above, weighted differently by each buyer.
Sophisticated buyers (funds, aggregators, PE-backed roll-ups) increasingly run a structured scoring model across these dimensions before they make an offer. They'll know your geographic density, your landlord concentration, your fee integrity, and your data quality before they've spoken to you.
That's the institutional era. It's already here. And it's why we built RolliScore — a verified, multi-factor portfolio score that takes the seven hidden factors above and produces a single number reflecting the actual defensibility of your rent roll under institutional scrutiny.
What to do this quarter (if you're 6–24 months from a sale)
If you're considering selling within the next two years, three actions move the needle more than anything else:
1. Get a baseline measurement of the seven factors above. You can't improve what you can't see. Most Principals operate on the spreadsheet number alone and have no visibility on density, concentration, or fee leakage. Get the baseline first.
2. Address fee integrity systematically. A 12-month fee normalisation programme — gradually rebasing legacy managements to current market rates — is the highest-ROI improvement available to most Principals. It compounds through the multiplier.
3. Don't sell into uncertainty. The Australian rent roll asset class is professionalising rapidly. Buyers in 2027 will be more data-literate, more analytical, and less willing to pay for "trust me" portfolios. The Principals who treat the next 12–18 months as a preparation window — and who can hand a buyer a verified score, not a PDF — will materially outperform on sale.
The bottom line
Your rent roll is not worth what your broker writes on a napkin.
It's worth what the DNA underneath the napkin says it's worth — and the buyers are now reading the DNA whether you're showing it to them or not.
The only question is whether you find your number first, or whether they find it for you 48 hours before settlement.
Want to know your RolliScore?